Statistical Portraits: Admissions
The figure below shows how UMass Boston is shifting away from being a "transfer-school" as the number of first-time freshman application and admitted students are booming while these numbers remain stable for the transfer students.
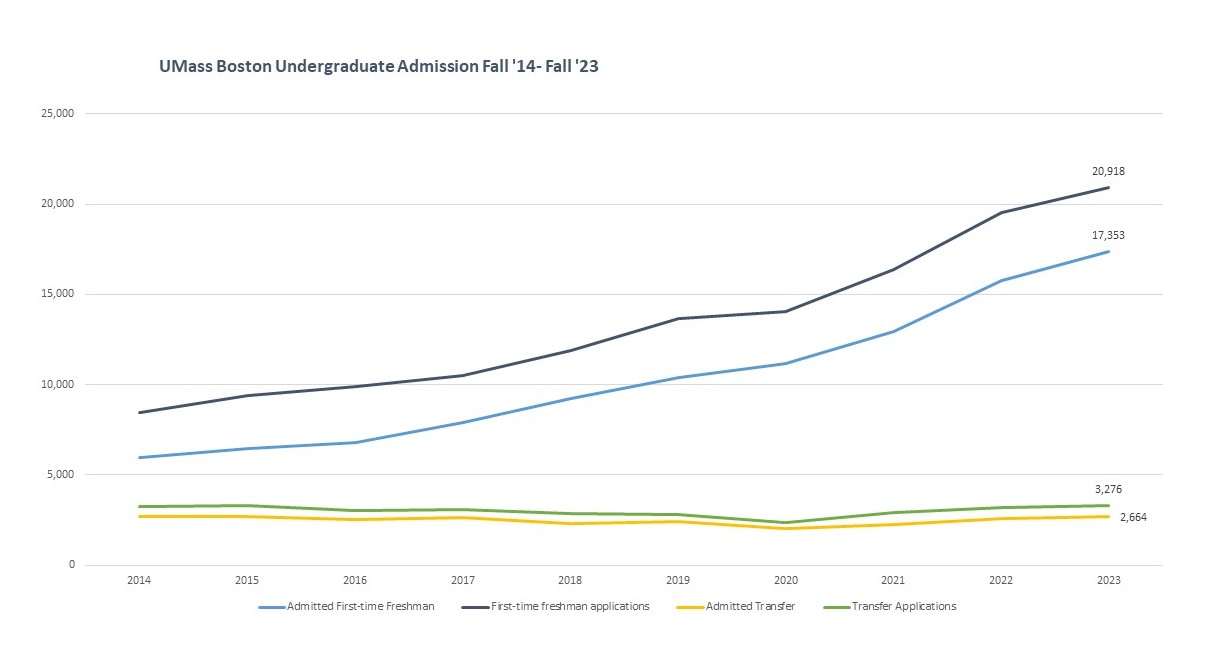
Graph Source: Statistical Portrait Table 7
University Admissions
Undergraduate Admissions [Fall 2023 Table 7 Excel] [Fall 2023 Table 7 PDF] (Table 7)
Undergraduate Admissions by Race/Ethnicity [Fall 2023 Table 8 Excell] [Fall 2023 Table 8 PDF] (Table 8)
New Undergraduate Students by Gender & Race/Ethnicity [Fall 2023 Table 9 Excel] [Fall 2023 Table 9 PDF] (Table 9)
Top Feeder High Schools for New Freshmen [ Excel ] [ PDF ] (Table 10)
Mean SAT Scores of Entering Freshmen [ Excel ] [PDF ] (Table 11)
Distribution of SAT Scores: Entering Freshmen [ Excel ] [ PDF ] (Table 12)
Mean GPA of Entering Transfer Students & Top Feeder Institutions [ Excel ] [ PDF ] (Table 13 & 14)
Admissions by College
New Student Race/Ethnicity by College [Fall 2023 Table 21 Excel] [Fall 2023 Table 21 PDF] (Table 21)
SAT Scores of New Freshmen by College with Mean High School GPA of New Freshmen [ Excel ] [ PDF ] (Table 22)
Undergraduate Admissions by College [Fall 2023 Table 23 Excel] [Fall 2023 Table 23 PDF] (Table 23)
Undergraduate Spring Admissions by College [ Excel ] [ PDF ] (Table 24)
Graduate Admissions by Program [ Excel ] [ PDF ] (Table 39)
Graduate Admissions by College [ Excel ] [ PDF ] (Table 40)