Statistical Portraits: Enrollment
The figure below presents past 10 years’ enrollment trend at UMass Boston by undergraduate and graduate level.
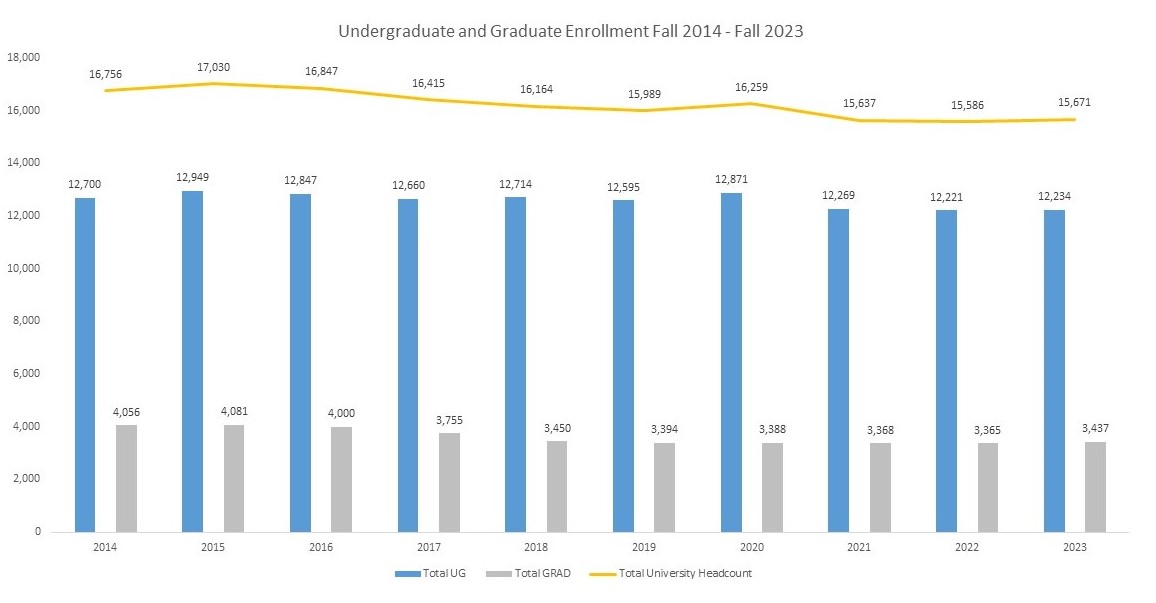
Source: Statistical Portrait Table "Student Headcount & FTE by Full-time Part-time Status -- Includes Percent Female with Minority and Mean/Median Ages"
University Enrollment
- Total Student Headcount & FTE by Full-time/Part-time Status -- Includes Percent Female with Minority and Mean/Median Ages [Fall 2023 Table 1 Excel] [Fall 2023 Table 1 PDF ] (Table 1)
- Enrollment by Tuition Residency and Citizenship Status [ Fall 2023 Table 2 Excel] Fall 2023 Table 2 PDF] (Table 2)
- Headcount & FTE Enrollment by Student Level [Fall 2023 Table 3 Excel] [Fall 2023 Table 3 PDF] (Table 3)
- Headcount Enrollment by Gender and Race/Ethnicity [Excel ] [PDF] (Table 4A)
- Enrollment by Full-time/Part-time, Degree-seeking Status, Gender & Race/Ethnicity [ Table 4B Enrollment by FT/PT, DS & Ethnicity] (Table 4B)
- 12 Month Credit Hour Activity & FTE [Fall 2023 Table 5 Excel] [Fall 2023 TABLE 5 PDF] (Table 5)
- 12 Month Unduplicated Headcount [Fall 2023 Table 6 Excel] [Fall 2023 TABLE 6 PDF] (Table 6)
- Headcount & FTE by College [ Excel ] [ PDF ] (Table 19)
- Student Enrollment by Race/Ethnicity & College [ Excel ] [ PDF ] (Table 20)
- Instructional FTE by College [ Excel ] [ PDF ] (Table 25)
- UMass Boston Induced Course-Load Matrix [ Excel ] [ PDF ] (Table 26)
Enrollment by Program
- Continuing and Professional Studies Enrollment by Matriculation Status, Gender & Race/Ethnicity -- Includes Mean & Median Age [ Excel ] [ PDF ] (Table 27) No Longer Updated
- Continuing and Professional Studies Headcount & Student Credit Hours by Semester/Session -- Includes New Student Enrollment [ Excel ] [ PDF ] (Table 28) No Longer Updated
- Annual Online Enrollment Demographics by Credit Courses [ Excel ] [ PDF ] (Table 29)
- Undergraduate Major Enrollment by Gender & Race/Ethnicity [ Excel ] [ PDF ] (Table 30)
- Undergraduate Majors [ Excel ] [ PDF ] (Table 31)
- Undergraduate Minors [ Excel] [ PDF ] (Table 32)
- Undergraduate Certificates & Programs of Study [Fall 2023 Table 33 Excel] [Fall 2023 Table 33 PDF] (Table 33)
- Graduate Program Enrollment by Gender & Race/Ethnicity [ Excel ] [ PDF ] (Table 37)
- Graduate Program Enrollment [ Excel ] [ PDF ] (Table 38)
Office of Institutional Research, Assessment, and Planning
Quinn Administration Building, 3rd Floor, Room 13
617.287.5420
inst.research@umb.edu