Population by Race and Latino Origin in Boston, 2020
| Race | 2010 | 2020 | % Change | % of Total Population |
|---|---|---|---|---|
| Asian American | 55,235 | 76,021 | 37.6% | 11.3% |
| White | 333,033 | 318,101 | -4.5% | 47.1% |
| Black or African American | 150,437 | 138,870 | -7.7% | 20.6% |
| American Indian/Alaska Native | 2,399 | 2,824 | 17.7% | .4% |
| Native Hawaiian/Pacific Islander | 265 | 356 | 34.3% | .1% |
| Some Other Race | 51,893 | 68,274 | 31.6% | 10.1% |
| TOTAL ONE RACE | 593,262 | 604,446 | 1.9% | 89.5% |
| TOTAL TWO OR MORE RACES | 24,332 | 71,201 | 192.6% | 10.5% |
| TOTAL POPULATION | 617,594 | 675,647 | 9.4% | 100.0% |
| Hispanic or Latino* | 107,917 | 126,113 | 16.9% | 18.7% |
| White, non-Hispanic | 290312 | 301464 | 3.8% | 44.6% |
* Hispanics and Latinos may be of any race.
Source: 2010 and 2020 Decennial Censuses, retrieved by the Institute for Asian American Studies
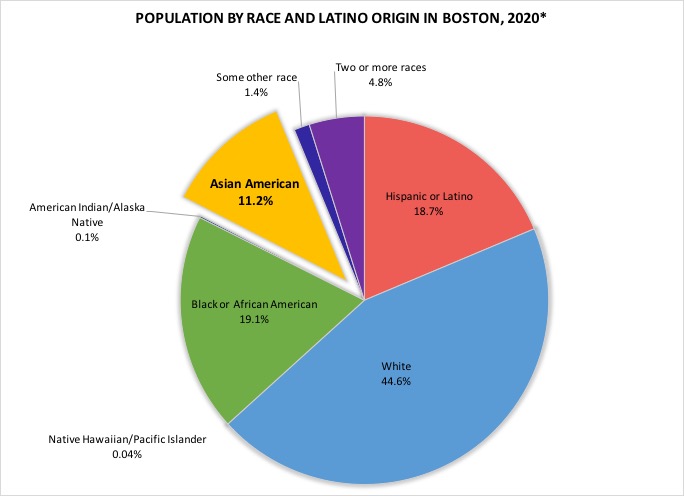
* Hispanics and Latinos may be of any race. In this chart, the data for racial groups do not include HIspanics or Latinos so the total will be 100%.
Source: 2010 and 2020 Decennial Censuses, retrieved by the Institute for Asian American Studies