Statistical Portraits: Retention and Graduation
University Retention and Graduation
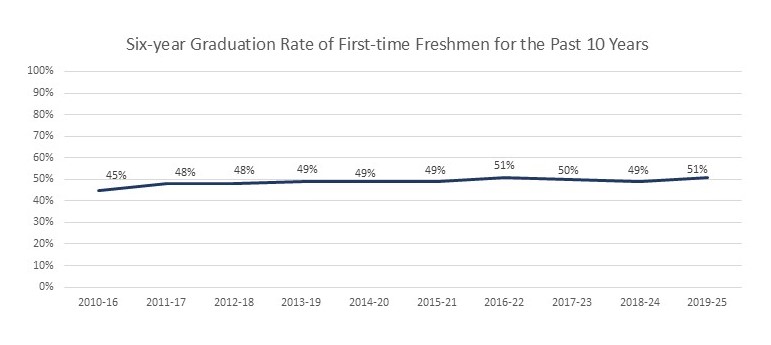
Six-year graduation rate for first-time first-year students have remained stable over the past decade, ranging from 45% to 51% with a slight upward trend in recent cohorts.
University Retention and Graduation
Retention Rates: Freshmen & Full-time Transfer Students [Fall 2025 Table 15 Excel] [Fall 2025 Table 15 PDF] (Table 15)
Graduation Rates: First-time Freshmen & Upper Division Transfer Students [Fall 2025 Table 16 Excel] [Fall 2025 Table 16 PDF] (Table 16)
Degrees Conferred by Level [Fall 2025 Table 17 Excel] [Fall 2025 Table 17 PDF] (Table 17)
Bachelor's & Master's Degrees Conferred by Gender & Race/Ethnicity [Fall 2024 Table 18 Excel] [Fall 2024 Table 18 PDF] (Table 18)
Undergraduate Degrees Conferred by Gender & Race/Ethnicity [Fall 2024 Table 34 Excel] [Fall 2024 Table 34 PDF] (Table 34)
Undergraduate Certificates Awarded - Academic Year [Fall 2025 Table 35 Excel] [Fall 2025 Table 35 PDF] (Table 35)
Bachelor's Degrees Conferred: Ten-year Trend [Fall 2024 Table 36 Excel] [Fall 2024 Table 36 PDF] (Table 36)
Graduate Degrees Conferred by Gender & Race/Ethnicity [Fall 2023 Table 41 Excel] [Fall 2023 Table 41 PDF] (Table 41)
Graduate Degrees Conferred, Academic Year [Fall 2024 Table 42 Excel] [Fall 2024 Table 42 PDF] (Table 42)