Methodology
NSF Beacon Survey Methodology
The NSF-Beacon survey is a collaboration of the Boston Area Research Initiative (BARI) at Northeastern University, the Center for Survey Research (CSR) at University of Massachusetts Boston, and the Boston Public Health Commission (BPHC), funded by the National Science Foundation’s Human-Environment and Geographical Sciences (HEGS) program through a grant for rapid-response research (RAPID) for collecting ephemeral data during or following a crisis. The survey asked 1370 Bostonians about their experiences during the first months of the COVID-19 pandemic, including ability and tendency to follow social distancing recommendations, attitudes towards regulations, and economic and personal impacts of the pandemic. The design allows for a unique observation of neighborhood-level estimates for these factors.
I. Sample Design and Final Sample
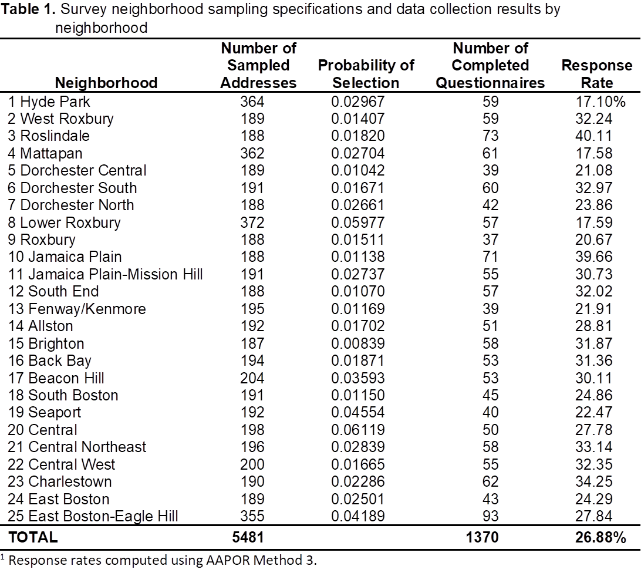
The NSF-Beacon survey used a stratified random sample that divided the city of Boston into 25 distinct neighborhoods. The neighborhoods were defined in collaboration with members of the Mayor’s Office and other experts based on social, demographic, and historical salience. They were constructed to conform to census block group boundaries, meaning that metrics associated with census geographies (including from the U.S. Census Bureau) could be linked with the data. The Marketing Systems Group (MSG) was contracted to draw a simple random sample of residential addresses from within each neighborhood. They used the most recent United States Postal Service Computerized Delivery Sequence File (CDSF) to draw Address-Based Samples (ABS) of residential addresses. Four neighborhoods with a higher proportion of Black or Latinx populations were oversampled (Hyde Park, Mattapan, Lower Roxbury, and East Boston-Eagle Hill). As shown in Table 1, there were unbalanced sample sizes and selection probabilities across neighborhoods, meaning analysis of the data requires survey weights to correct for these differences. In addition to the survey being administered to the sample obtained for the NSF-Beacon study, we also invited participants in the previously constructed Beacon panel, which had been recruited using the same 25 neighborhood stratified sample design.
II. Data Collection Methodology
Paper copies of the survey, plus instructions for completing and returning, and a $2 cash incentive were mailed to all sampled addresses. For three neighborhoods known to have higher percentages of Hispanic households, the materials mailed, including the survey instrument, were in both English and Spanish. All recipients were also given the option of completing the survey online and an associated URL. A randomly assigned half of the mailed questionnaires had instructions for the oldest adult 18+ in the household to complete the survey while the other random half had instructions for the youngest adult 18+ to complete the survey. In this manner, an attempt was made to randomize the age of the respondent within the household completing the survey. Approximately two weeks after the initial mailing of materials, a second mailing was sent to nonrespondents, though with no additional incentive.
III. Data Collection Results
The final sample included 1370 completed surveys (1208 paper, 162 online; 30 were completed in Spanish). The number of completed surveys ranged from 37 in Roxbury to 93 in East Boston-Eagle Hill. Overall response rate was 26.88% and ranged from a low of 17.10% in Hyde Park to a high of 40.11% in Roslindale. Full details on each neighborhood sample are presented in Table 1. An additional 256 completed surveys were obtained from members of the previously constructed Beacon panel, bringing the total number of completed surveys to 1626.
IV. Weighting of survey data
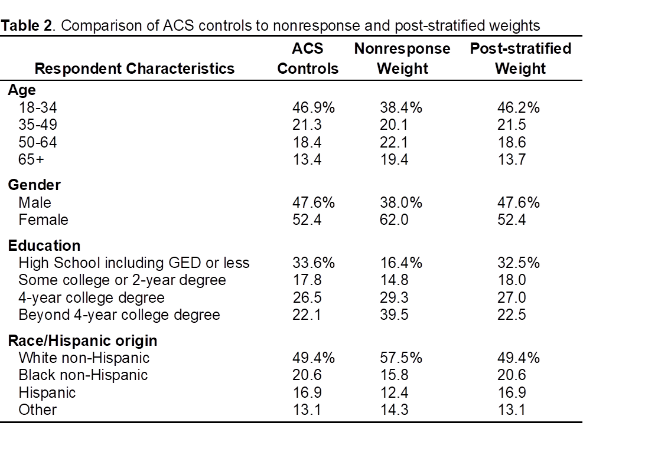
The sample requires weighting to account for both differing probabilities of selection and response rates across neighborhoods, especially insofar as these differences create a sample that is demographically and geographically non-representative. We created two survey weights, one for sample design factors including probability of selection and number of adults in the household adjusted for nonresponse bias across neighborhoods, the other which adds a post-stratified weight to account for demographic non-representativeness. Additionally, we conducted this process twice. First, we did it only for respondents to the NSF-Beacon survey. Second, we replicated the procedures for the dataset that combined the NSF-Beacon survey responses with respondents from the previously constructed Beacon panel (values reported in Table 2 for weighting are highly similar for the NSF-Beacon responses alone and the merged data set).
Weights for Nonresponse Bias
Weighting for nonresponse began by neighborhood with the inverse of the probabilities of selection adjusted for the response rates displayed by neighborhood according to the equation (see Table 1 for values):
Wb = (Inverse of probability of selection) / (neighborhood response rate)
The final nonresponse adjusted weight further multiplies the base weight by the number of adults 18+ in the household (capped at 4 to prevent excessively large weights). Finally, these weights are adjusted so that the percentage of the total 18+ population in Boston that belongs in each neighborhood agreed with control percentages computed from the 2014-2018 5-year American Community Survey (ACS) data from the Census Bureau. These weights sum to the ACS estimate of the total 18+ population in the city of Boston. Therefore, the final nonresponse adjusted weight can be defined as:
WNR = (Wb)(number of adults in household)(ACS population adjustment factor) 16
Post-Stratified Weights
As shown in Table 2, even after nonresponse weights, the respondents to the survey were not demographically representative of Boston’s population. Most notably, people with education beyond 4-year college degrees were overrepresented and those with a high school education or less were underrepresented. Women were also overrepresented relative to men and White non-Hispanics were overrepresented relative to Blacks and Hispanics. There was also a smaller age bias with too many 65+ people and too few 18-34. A final adjustment to the survey weights was implemented to adjust for differential survey nonresponse by age, gender, race/Hispanic origin, and education. Control percentages for these categories were computed from the 2014-2018 5-year ACS data. Post-stratification factors were then computed to match weighted survey data to citywide percentages. The final post-stratified weight can be expressed as:
WPS = (WNR)(post-stratified factors)
It should be noted, though, that a small amount of trimming of weights, less than one percent of all sample cases, was employed to prevent some extreme values in the post-stratified weights. As shown in Table 2, this additional adjustment process brought the weighted survey estimates much more in line with ACS citywide estimates.
Weights for the second mail and web-based survey.
For the follow-up survey, where 932 of the original 1626 respondents answered questions, new post-stratification factors were developed to again match weighted survey data to the 2014-2018 5-year ACS.